Graphics Interpretation (GI) is an essential question type that assesses your ability to analyze and interpret visual data. Doing well in these question types is mandatory for excelling in the GMAT Focus Data Insights (DI) section. However, navigating the various kinds of graphs can feel like a real challenge, and most candidates end up feeling a bit overwhelmed.
Are you one of those people?
Are you finding yourself puzzled over where to start? If you’re seeking some clear guidance and useful tips on how to handle these questions, you’ve come to the right place.
Welcome to our blog!
Here, we’ve crafted a friendly guide to help you build a solid foundation to tackle Graphics Interpretation questions in the Data Insights section. We’ll walk you through the different types of graphs you’ll encounter and share some top-notch strategies to boost your confidence. By the end of this blog, you’ll understand what to expect and how to excel in this question type .
In this blog, we will look at:
What Are Graphics Interpretation Questions?
- Significance of Graphics Interpretation Questions
- The Structure of Graphics Interpretation Questions
- Types of Graphs and Charts Commonly Encountered
- Approach and Strategy to solve GI Questions
Essential Skills for Graphics Interpretation
- Analytical Skills: Reading and Interpreting Data
- Mathematical Skills: Calculations Based on Visual Data
- Attention to Detail: Noticing Subtle Differences and Patterns
Strategies for Effective Graphics Interpretation
- Reading Graphs Correctly: Axes, Scales, and Legends
- Estimating and Approximating: When Exact Values Aren’t Necessary
- Tackling Complex Charts: Multi-layered Information Processing
Answering Graphics Interpretation Questions
Common Challenges with Graphics Interpretation

Grab your free copy of ‘Demystifying GMAT FE’
What are Graphics?
Graphics refer to visual elements such as charts, graphs, diagrams, and images used to represent data or information. In the context of GMAT Focus Graphics Interpretation questions, graphics are provided to test your ability to interpret and analyze visual data accurately.
What Are Graphics Interpretation Questions?
Graphics Interpretation Questions form a crucial part of the GMAT Focus Data Insights section and test your ability to decipher and analyze graphical data with precision. These questions challenge you to engage directly with a variety of graphical formats, ranging from column charts and line graphs to more complex visual displays like Venn diagrams and scatterplots.
Those familiar with the Classic GMAT might realize that Graphics Interpretation questions were once found in the Integrated Reasoning (IR) section of the old GMAT but have now found their way to the Data Insights section of the GMAT Focus test.
Significance of Graphics Interpretation Questions
Understanding Graphics Interpretation Questions is vital to mastering the art of interpreting complex graphical data.
Understanding how to analyze these questions goes beyond just recognizing what is presented graphically. Each detail in a graph or chart, such as axis labels, scales, and legends, guides you in understanding the context of the data, which is essential for making well-informed decisions during the test.
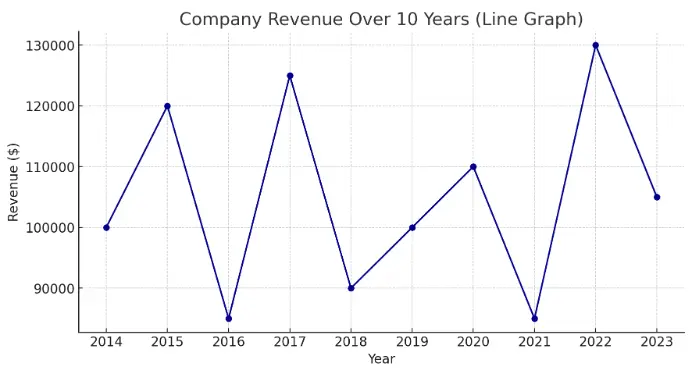
For example, consider a line graph representing a company’s revenue from 2014 to 2023.
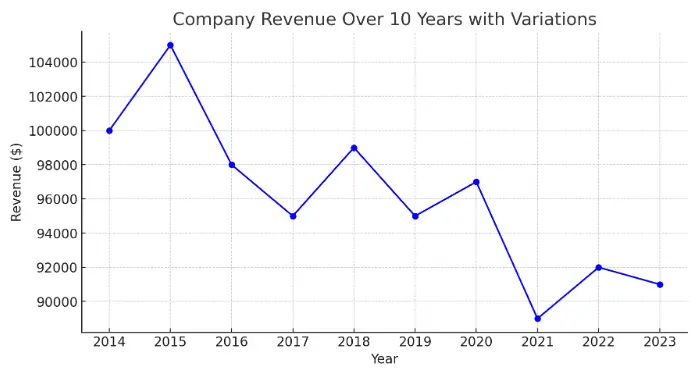
As you can see, the line graph reflects the different business conditions during each year, providing a realistic view of the company’s financial performance. This level of detail is crucial for precise interpretation.
Solving and analysing Graphics Interpretation Questions will train you to look deeper into the presented graphics and encourage a more analytical approach to data. The more familiar you are with interpreting these elements quickly and accurately, the better your performance will be on the exam.
Having said that, this skill is not only beneficial for acing the GMAT but is also invaluable in real-world business scenarios where data-driven decisions are the norm.
Remember, success in this crucial part of the exam can significantly boost your Data Insights score and, thereby, your overall GMAT score. Take the time to thoroughly understand and apply the strategy and insight presented in this blog, and in just a short time, you’ll find yourself enjoying the process of deciphering complex data.
Significance of Graphics Interpretation Questions
There will be three parts in a GI question. All parts will be presented at once in the order shown below.
• A graph or multiple graphs / a graph and a table
• Details about the graph(s) in the text format.
• Either…
one question statement with two blanks
or two question statements with one blank each.
Each blank will have a dropdown with minimum 2 to max 6 answer choices.
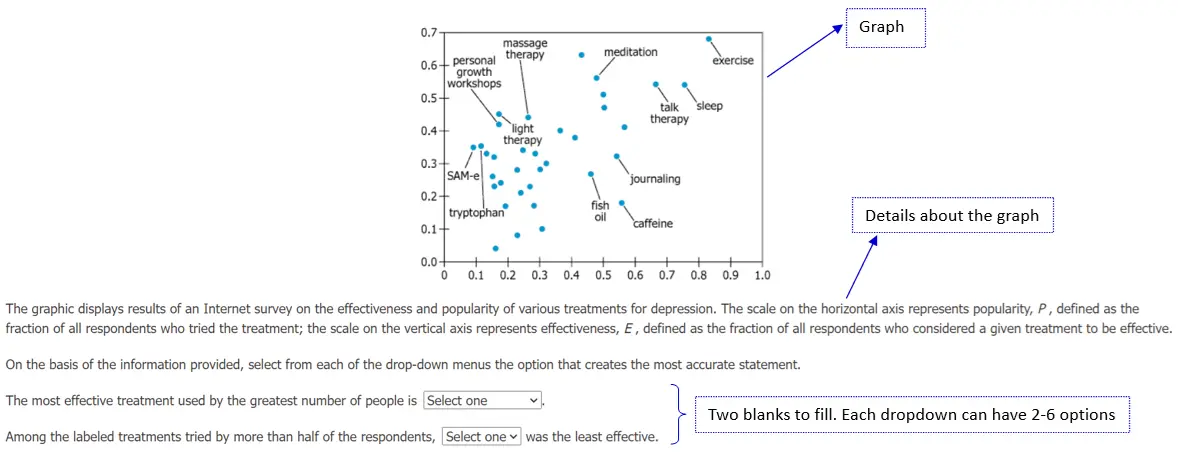
To get a high score in GI questions, you must answer both parts of the question correctly. No partial credit is available. This emphasizes the importance of a thorough analysis and integration of the visual data with the textual information to ensure that your interpretations are accurate.

Grab your free copy of ‘Demystifying GMAT FE’
Types of Graphs and Charts Commonly Encountered
Graphic Interpretation questions on the GMAT Focus test your ability to understand and analyze a wide array of graphical displays. Becoming familiar with the different types of graphs and charts, such as line graphs, bar charts, pie charts, and scatter plots, can significantly increase your accuracy level and reduce the time taken when tackling these questions.

| Graph Type | Qualitative Graphs | Quantitative Graphs |
|---|---|---|
| Graphs tested on GI Questions on the GMAT Focus Edition | Venn Diagram, Network Diagram, Tree Diagram, Flowchart | Pie Chart, Bar Chart (Grouped, Stacked), Histogram, Line Chart, Scatter Plots (Bubble Chart), Normal Graph |
Here’s a brief overview of the types of Qualitative Graphs you might encounter:
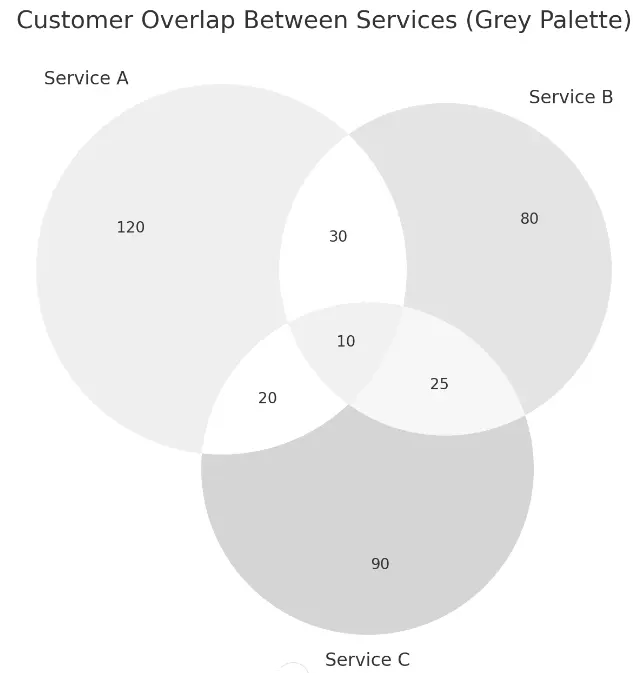
Venn diagrams: A Venn diagram is made up of overlapping circles, each set representing a group of items. The areas of overlap show common elements between sets, useful for illustrating relationships.
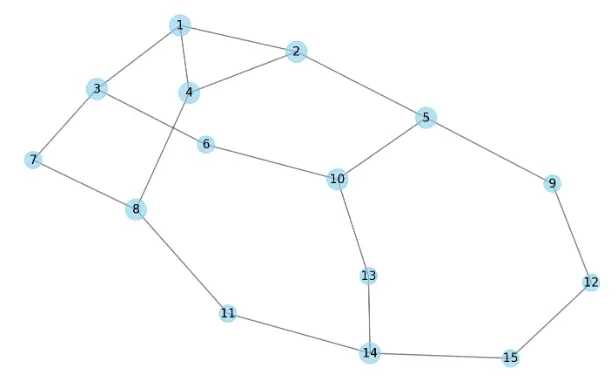
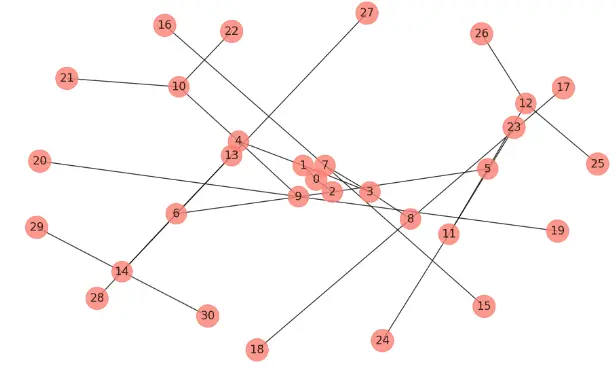
Network Diagram: This diagram represents entities as nodes and the connections between them as edges, highlighting how different points are linked.
Tree Diagram: A Tree diagram branches out in a tree structure to show hierarchical relationships, starting from a root node that branches out into several nodes.
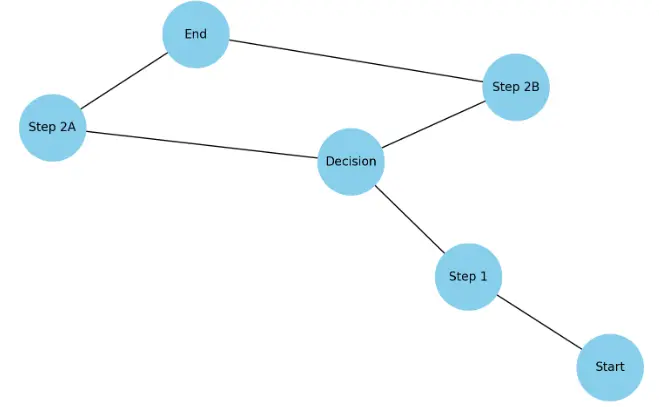
Flow chart: A flow chart is a graphical representation of a process, showing the steps as boxes of various kinds and their order by connecting them with arrows. It is used to outline a complex process in a clear and concise manner.
Here’s a brief overview of the types Quantitative Graphs you might encounter:
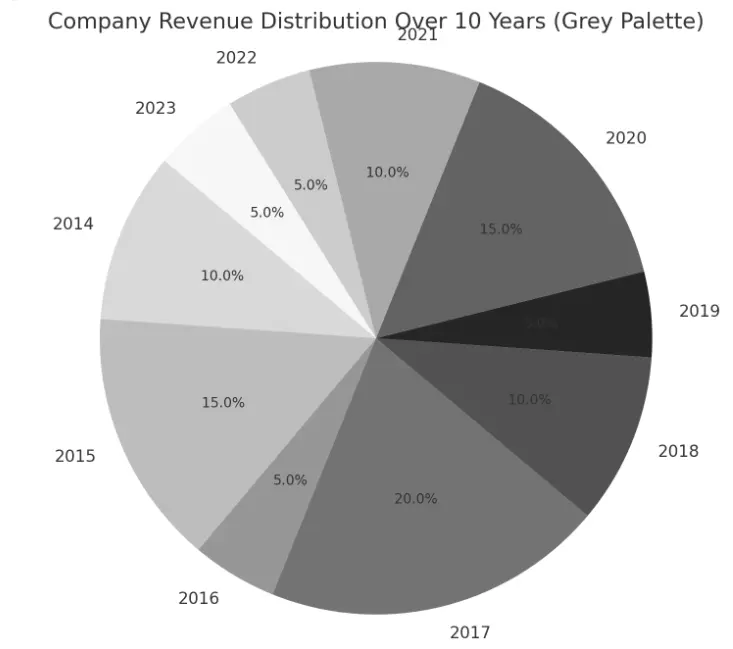
Pie charts: This circular chart is divided into sectors, each representing a proportion of the whole. It is commonly used to show percentage or proportional data.
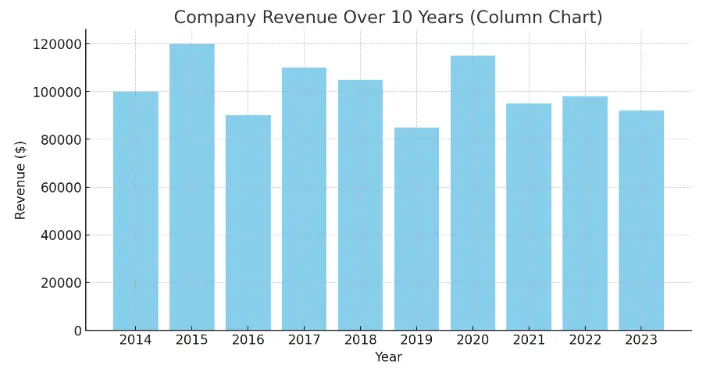
Bar charts: A Bar chart is a visual representation using bars to compare different categories of data, where each bar’s height or length corresponds to its value.
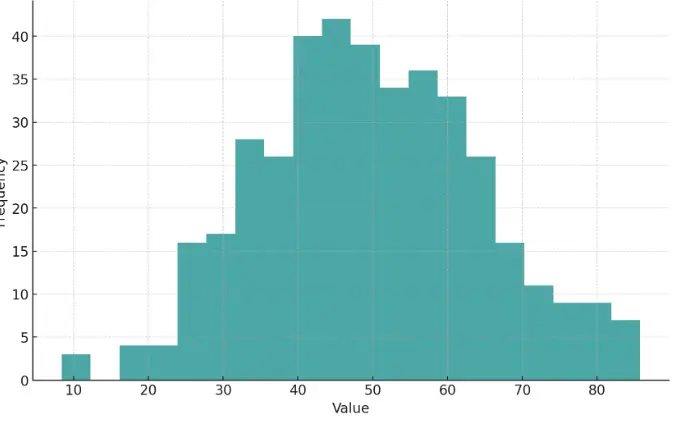
Histogram: A Histogram uses bars to show the frequency of data points within specified ranges. It is typically used to visualize the distribution of numerical data.
Line graphs: This graph uses a continuous line to connect data points plotted on a coordinate plane. It is typically used to show trends or changes over time.
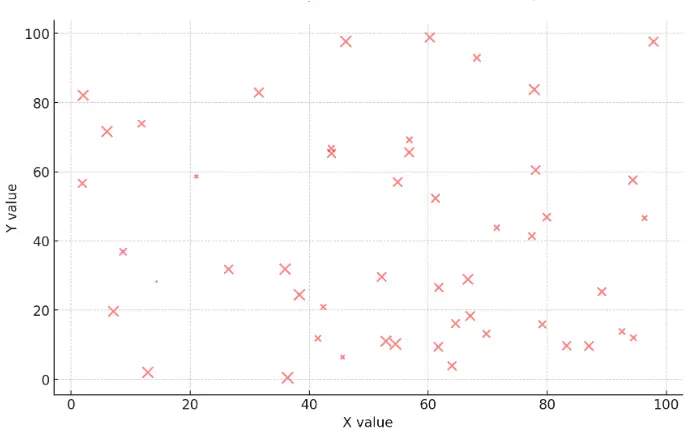
Scatterplots: A Scatterplot uses Cartesian coordinates to display values for typically two variables. Each point represents the values of two variables.
Essential Skills for Graphics Interpretation
Mastering GI questions in the GMAT requires a set of specialized skills that are crucial for analyzing and understanding the graphical data presented. The skills required are:
Analytical Skills
Reading and Interpreting Data: The ability to scrutinize data points in graphs is crucial because it allows you to extract meaningful insights. By identifying trends, patterns, and relationships between variables, you can uncover valuable information that informs your decision-making process. Develop your ability to scrutinize the data points in graphs. Look for trends, patterns, and relationships between variables.
Making Informed Decisions: Analyzing data in context with the question asked is essential for drawing accurate conclusions. Understanding how the data aligns with the overall message or purpose of the graph enables you to make informed decisions based on a thorough understanding of the information presented. Analyze the data in context with the question asked. Think about how the data aligns with the overall message or purpose of the graph.
Connecting the Dots: Identifying connections or correlations among different elements within the graph is vital for a comprehensive interpretation. By noting any unusual patterns or relationships, you can uncover hidden insights that may influence your interpretation and lead to a deeper understanding of the data. Identify connections or correlations among different elements within the graph. Note any unusual patterns that might influence your interpretation.
Mathematical Skills
Understanding Scales and Units: Accurate interpretation of data relies on understanding the scales and units used in the graph. Being able to interpret these correctly and perform necessary conversions ensures that your analysis is precise and meaningful.
Applying Mathematical Concepts: Utilizing basic math concepts such as percentages, ratios, averages, and trends allows for a deeper analysis of the data presented in visuals. Applying these mathematical principles enables you to extract valuable information and draw relevant conclusions.
Practicing Mental Math: The ability to perform quick calculations mentally is invaluable for efficiently solving GI questions. Regular practice of estimation and approximation techniques enhances this skill, enabling you to streamline your analysis process and arrive at solutions more efficiently.
Attention to Detail
Thorough Examination: Paying meticulous attention to every component of the graph ensures that no detail is overlooked. From axis labels to individual data points, thorough examination is essential for accurate interpretation and analysis. Keep in mind that you may need to convert data before you use them.
Spotting Subtle Differences: Looking for slight variations or anomalies in the data is crucial for uncovering hidden insights. Identifying unusual data points allows for a deeper understanding of the graph and may reveal important nuances that impact your interpretation.
Recognizing Patterns: Detecting and understanding patterns or trends in the data provides valuable insights into the underlying dynamics. By recognizing these patterns, you can gain a better understanding of the data and how it relates to the overall message or objective of the graph.
Strategies for solving Graphics Interpretation Questions
When you’re working on Graphics Interpretation questions, it’s important to use strategies that improve your skills in understanding visual data. Take a step-by-step approach to look at each part of the graph carefully, like understanding the axes and labels, and noticing any trends. This helps you understand the data better. Also, practicing with different types of graphs helps you get faster and better at analyzing them. This way, you’ll be ready to make smart decisions during the real exam.
There are some specific strategies we need to keep in mind.
Reading Graphs Correctly: Axes, Scales, and Legends
Reading graphs correctly is crucial for accurate interpretation in Graphics Interpretation questions. There are some key factors we need to consider when reading graphs.
Axes: Pay attention to the labels on the x-axis and y-axis, which indicate the variables being measured. Understand the relationship between these variables and how they affect the data in the graph.
Scales: Interpret the scale used on each axis to understand the range and units of measurement. Consider the intervals between values and how they affect the visual representation of the data.
Legends: Refer to the legend to understand the meaning and representation of different elements in the graph. Legends provide critical information that helps in interpreting the data accurately.
Estimating and Approximating: When Exact Values Aren’t Necessary
Exact values are not always necessary in Graphics Interpretation questions. Estimating and approximating can be effective strategies for interpreting data and answering questions. Here’s why:
Estimating: Instead of trying to extract an exact value from a graph, focus on identifying the range or approximate value. This can help you eliminate answer choices that are clearly outside the estimated range.
Approximating: If the scale on the graph is not precise, you can round values to make calculations easier. This can save time and prevent errors in complex calculations.
Grab your free copy of ‘Demystifying GMAT FE’

Tackling Complex Charts: Multi-layered Information Processing
Complex charts in Graphics Interpretation questions often require multi-layered information processing.
Break it down: Divide the chart into smaller sections or components to better understand the data and relationships between different elements.
Prioritize: Identify the most relevant information and focus on understanding the key messages conveyed by the chart. Avoid getting overwhelmed by unnecessary details.
Make connections: Look for patterns, trends, or correlations between different elements in the chart. Consider how these relationships contribute to the overall message or purpose of the chart.
Practice visual analysis: Develop your ability to quickly scan and interpret complex charts. Regular practice with various types of charts will improve your skills in multi-layered information processing.
Approach to solve GI Questions
Solving GMAT Focus Graph Interpretation questions can be smooth sailing if you follow this approach:
Step 1: Brief analysis of the Graph
Take a quick glance at the graph or charts, but remember that there is no need to memorize every little detail right away. If there’s more than one graph or if a table has also been presented, find what they have in common.
Step 2: Read the Text
Check out the words around the graph. Sometimes, they hide important clues. Make sure to understand what the graph titles and labels are telling you.
Step 3: Estimate When You Can
If you need to find a value but it falls between two numbers on the graph, just make a good guess. Look for hints in the question like ‘nearest to’ or ‘closest to’ — they mean it’s okay to estimate.
Answering Graphics Interpretation Questions
Ok…let’s keep the strategies and approach in mind and try to solve a GI question!
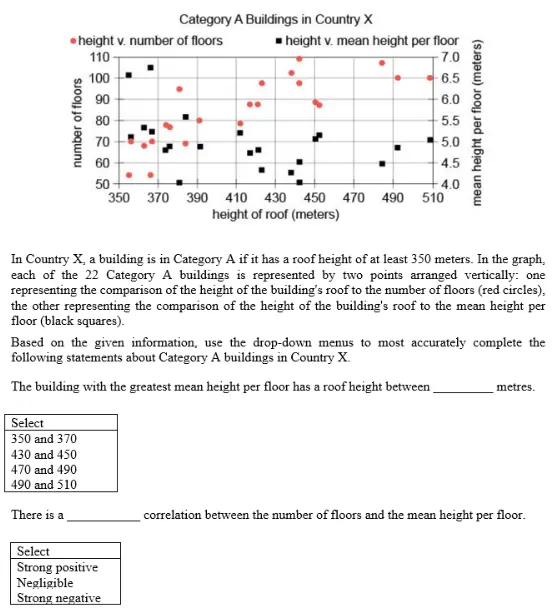
Let’s follow the three steps to solve this question.
Step 1: Brief Analyses of the Graph
Identifying the units in the graph is very important. In this case, the graph includes one red and one black dot for each of several buildings. Each building has a height between 350 and 510 meters. That measurement is mentioned in the x-axis.
Step 2: Read the text accompanying the graph.
There are two y-axes. On the left, we have “number of floors,” and each building has a red dot that reflects the number of floors given the building’s height. For instance, the red dot in the far lower left tells us that a building roughly 355 meters high has approximately 53 floors.
The black dots reflect the “mean height per floor,” which is the y-axis on the right. The black dot that refers to that same ~355-meter-high building is near the top of the graph, indicating that that building’s mean height per floor is just above 6.5 meters.
The intro says there are 22 buildings. Thus, the graph contains 22 black dots and 22 red dots–one of each for each building.
Step 3: Estimate
The first Blank asks you to identify the building with the greatest mean height per floor. Mean height per floor is the black dot, and the highest black dot is near the upper left corner of the graph, corresponding with a roof height of about 365 meters. Thus, the height of this building is between 350 and 370 meters. Fairly to-the-point kind of question.
The second Blank refers to a concept that you may not be familiar with: correlation.
There are three choices: strong negative, negligible, and strong positive.
If a correlation is positive, it means that when one attribute is high, the other is generally high, and vice versa.
When a correlation is negative, if one attribute is high, the other is low, and vice versa.
A negligible correlation refers to situations where there is no consistent relationship between the two attributes.
When the points on a scatter plot lies more or less in a straight line that is called correlation.
When it’s a straight line with a positive slope, that’s positive correlation, and when it’s a negative slope, that’s negative correlation
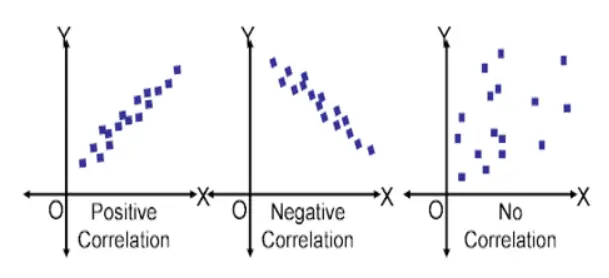
In this example, the correlation is strong negative. For most of the buildings with roof heights of 410 and above, the red dots are high and the black dots are low. For two of the shortest buildings, the black dots and high and the red dots are low. There are a few instances where both are in the middle, but in general, one attribute is high and the other is low.
So the answer would be strongly negative.
What are the common mistakes people make when interpreting graphics?
Graphics Interpretation questions can present challenges that may impact your performance on the GMAT. With GI questions making up 10 – 25% of the Data Insights section, avoiding common mistakes is essential for a strong performance. From misreading graphs and charts and overlooking key data points to not being able to effectively manage time, you will need to tackle several challenges while answering DI questions.
Misreading Graphs and Charts
Misreading graphs and charts is a common challenge in Graphics Interpretation questions. Here are some strategies to avoid misreading:
Read the question carefully: Understand what information is being asked for to focus on the relevant parts of the graph. Pay close attention to avoid traps in the question stem or data descriptions.
Analyze the data: Be meticulous when analyzing the graph. Look for trends, patterns, and relationships between different elements. Before diving into the questions, quickly identify any clear trends, patterns, or anomalies.
Verify your interpretation: After interpreting the data, double-check your understanding by referring back to the question to ensure it aligns with the context.
Practice with a variety of graphs: Familiarize yourself with different types of graphs and charts, understanding their unique ways of presenting data to improve your reading and interpretation skills.
Use the process of elimination: Before solving a GI question, you must check the options presented in the drop-down menu. Many a time, certain information will be presented in the graph but will not be presented in the options. Checking the options in advance and eliminating options accordingly can help save time by avoiding unnecessary calculations of objects that are not in the options.
Overlooking Key Data Points
Overlooking key data points can lead to errors. To combat this:
Read the Graph Carefully: Pay attention to all elements of the graph, including axis labels, legends, and data points. Make sure to understand the information presented fully.
Identify Key Information: Start by recognizing what the graph is showing, such as the units of measurement and the time frame, so that you can focus on data that is relevant.
Analyze the Data Systematically: Take a methodical approach to analyze the graph. Break it down into smaller sections or components to ensure you capture all important details.
Practice Active Reading: Engage actively with the graph, consistently checking your understanding to stay focused and attentive to crucial data points.
Time Management Issues
Time management is a common challenge in Graphics Interpretation questions. Here are some strategies for effective time management:
Practice with a Timer: Simulate the time constraints of the GMAT Focus by setting a timer during practice sessions. This helps develop a sense of how much time to allocate to each question.
Prioritize Questions: Tackle easier questions first to build momentum and save time for more challenging ones.
Skip and Return: If you encounter a particularly challenging question, consider skipping it temporarily and returning to it later to avoid wasting time.
Practice Estimation: Many GI questions require understanding data trends and approximations rather than exact answers. Becoming comfortable with estimation can significantly save time.
Recommended Resources
Practice is key to mastering Data Sufficiency questions and achieving a high score on the GMAT exam. Here are some resources that you can use to practice and improve your skills:
GMAT™ Official Guide 2023-2024: eBook & Online Question Bank: This guide is a comprehensive resource that includes an eBook and an online question bank, offering a wide range of practice questions and answer explanations covering all sections of the GMAT.
GMAT™ Official Guide Data Insights Review 2023-2024: eBook & Online Question Bank: Focused on data analysis, this guide provides detailed insights and strategies for handling the data-driven aspects of the GMAT, supplemented by an eBook and an online question bank for targeted practice.
GMAT™ Focus Official Practice Questions – Data Insights: This set offers specialized practice questions designed to improve skills in interpreting and analyzing data, ideal for mastering the Data Insights sections of the GMAT.
GMAT™ Focus Official Starter Kit + Practice Exams 1 & 2: A starter kit for new GMAT test-takers, featuring introductory materials, tips, and two full-length practice tests to simulate the actual test experience.
GMAT™ Focus Official Practice Exams 3 – 6: A continuation of the GMAT practice series, this package includes four additional full-length practice exams, helping candidates to further refine their test-taking strategies and timing.
GMAT Club: GMAT Club is a popular online community where you can find a wealth of resources, including practice questions, explanations, and discussion forums. Engaging with the GMAT Club community can provide valuable insights and help you refine your problem-solving techniques.
GMAT Prep Courses: Explore Crackverbal’s specialized GMAT prep courses, such as GMAT Live Online, GMAT Personal Tutoring, and GMAT Fast Track, each designed to enhance your skills in Data Sufficiency questions and other question types.
By dedicating time to practice and utilizing these resources, you can strengthen your Graphics Interpretation skills and increase your chances of success on the GMAT.
Conclusion
As we conclude our exploration of Graphics Interpretation for the GMAT, keep in mind that excelling in this section goes beyond just analyzing charts and graphs. It’s about effectively translating visual data into meaningful insights, leveraging the strategic skills you’ve practiced. Be vigilant about common traps such as misinterpreting graphics or glossing over vital data.
Armed with persistence and the right strategies, you’ll do more than just handle Graphics Interpretation questions; you’ll master them.
Are you ready to tackle the GMAT with confidence and achieve your highest potential?
Should you need extra support or a different approach, talk to our expert GMAT Advisors. Let’s embark on this journey to success together!



0 Comments